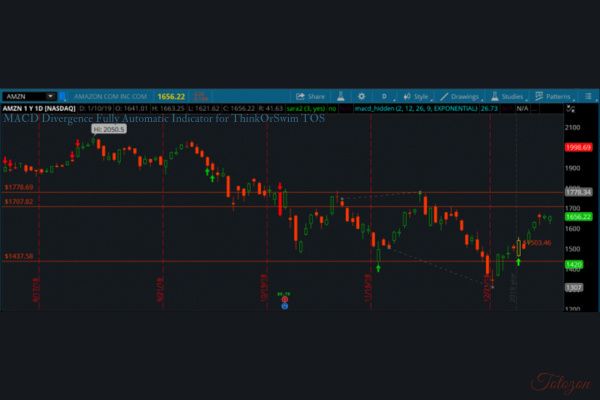
MACD Divergence Fully Automatic Indicator for ThinkOrSwim TOS
$6.00
File Size: Coming soon!
Delivery Time: 1–12 hours
Media Type: Online Course
MACD Divergence Fully Automatic Indicator for ThinkOrSwim (TOS)
Introduction to MACD Divergence
The Moving Average Convergence Divergence (MACD) is a popular technical analysis tool used by traders to identify changes in the strength, direction, momentum, and duration of a trend in a stock’s price. The MACD Divergence Fully Automatic Indicator for ThinkOrSwim (TOS) takes this powerful tool to the next level, automating the detection of divergences to help traders make more informed decisions.
What is MACD Divergence?
Understanding MACD
The MACD is calculated by subtracting the 26-period Exponential Moving Average (EMA) from the 12-period EMA. The result is the MACD line. A nine-day EMA of the MACD, called the signal line, is then plotted on top of the MACD line, which can function as a trigger for buy and sell signals.
Types of Divergence
- Bullish Divergence: Occurs when the price of a security makes a new low while the MACD forms a higher low. This indicates that the downward momentum is weakening, which could signal a potential upward reversal.
- Bearish Divergence: Happens when the price makes a new high while the MACD forms a lower high, suggesting that the upward momentum is weakening and a downward reversal might be on the horizon.
Benefits of Using the MACD Divergence Indicator
Automated Detection
The fully automatic indicator for TOS eliminates the need for manual monitoring and identification of divergences. This saves time and reduces the chances of missing critical signals.
Increased Accuracy
Automated systems are designed to follow precise algorithms, reducing human error and increasing the accuracy of divergence detection.
Enhanced Trading Decisions
By providing clear signals for potential market reversals, the indicator helps traders make more informed and timely trading decisions.
Setting Up the MACD Divergence Indicator in ThinkOrSwim
Installation Steps
- Download the Indicator: Access the ThinkOrSwim platform and download the MACD Divergence Fully Automatic Indicator.
- Import the Script: Go to the “Studies” section, select “Edit Studies,” and import the downloaded script.
- Apply the Indicator: Add the indicator to your chart and customize the settings according to your preferences.
Customizing the Indicator
- Adjusting Time Frames: Modify the time frame to match your trading strategy.
- Setting Alerts: Configure alerts to notify you when a divergence is detected.
How to Use the MACD Divergence Indicator
Identifying Bullish Divergence
Look for scenarios where the price forms lower lows, but the MACD forms higher lows. This indicates a weakening downtrend and a potential buying opportunity.
Identifying Bearish Divergence
Search for instances where the price forms higher highs, but the MACD forms lower highs. This suggests a weakening uptrend and a potential selling opportunity.
Integrating MACD Divergence with Other Indicators
Relative Strength Index (RSI)
Combining MACD Divergence with RSI can provide additional confirmation for potential reversals. RSI measures the speed and change of price movements, helping to identify overbought or oversold conditions.
Bollinger Bands
Using Bollinger Bands alongside the MACD Divergence Indicator can help identify volatility and potential price breakouts or breakdowns.
Advantages of Using ThinkOrSwim (TOS)
User-Friendly Interface
ThinkOrSwim offers a user-friendly interface that makes it easy to customize and apply various indicators, including the MACD Divergence Indicator.
Comprehensive Tools
TOS provides a wide range of tools and features, from real-time data to advanced charting capabilities, enhancing your overall trading experience.
Community and Support
ThinkOrSwim has a robust community and support system where traders can share insights, strategies, and get help with any issues they encounter.
Real-World Applications
Case Study: Successful Trades
Traders have reported successful trades using the MACD Divergence Indicator on TOS, highlighting its effectiveness in predicting market reversals and improving trading outcomes.
Testimonials
- John D.: “The MACD Divergence Indicator on ThinkOrSwim has significantly improved my trading accuracy. It’s a game-changer.”
- Emily R.: “I no longer have to manually search for divergences. The automatic alerts have made trading much more efficient.”
Potential Challenges and Solutions
False Signals
Like any technical analysis tool, the MACD Divergence Indicator can occasionally produce false signals. To mitigate this, combine it with other indicators for confirmation.
Customization Complexity
While the customization options are beneficial, they can be overwhelming for new users. Start with default settings and gradually adjust as you become more familiar with the tool.
Conclusion
The MACD Divergence Fully Automatic Indicator for ThinkOrSwim (TOS) is a powerful tool that enhances trading efficiency and accuracy. By automating the detection of divergences, it provides traders with timely and reliable signals for potential market reversals. Whether you are a novice or an experienced trader, this indicator can be a valuable addition to your trading toolkit.
Frequently Asked Questions
1. What is MACD Divergence?
MACD Divergence occurs when there is a discrepancy between the price action and the MACD indicator, signaling potential market reversals.
2. How does the MACD Divergence Indicator work on TOS?
The indicator automatically detects and alerts you to potential divergences, saving time and increasing accuracy.
3. Can I customize the MACD Divergence Indicator on TOS?
Yes, you can customize the indicator’s settings, including time frames and alerts, to match your trading strategy.
4. What are the benefits of using the MACD Divergence Indicator?
The benefits include automated detection, increased accuracy, and enhanced trading decisions by identifying potential market reversals.
5. How do I install the MACD Divergence Indicator on ThinkOrSwim?
Download the indicator, import the script into the “Studies” section of TOS, and apply it to your chart.
Be the first to review “MACD Divergence Fully Automatic Indicator for ThinkOrSwim TOS” Cancel reply
You must be logged in to post a review.


Reviews
There are no reviews yet.