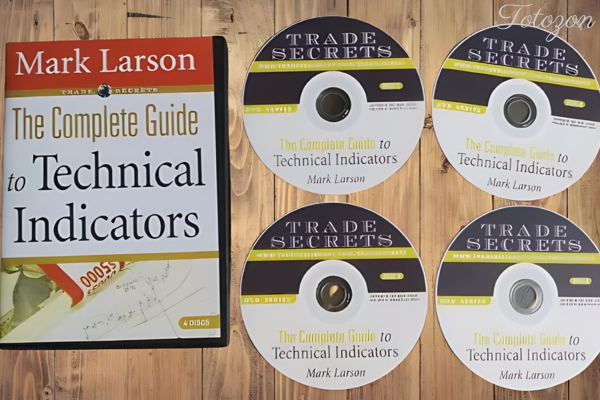
The Complete Guide to Technical Indicators with Mark Larson
$6.00
File Size: Coming soon!
Delivery Time: 1–12 hours
Media Type: Online Course
Content Proof: Watch Here!
You may check content proof of “The Complete Guide to Technical Indicators with Mark Larson” below:
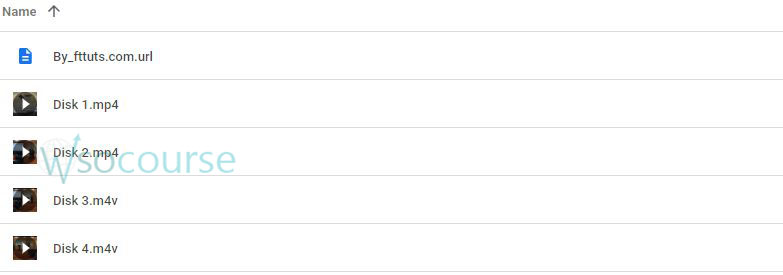
The Complete Guide to Technical Indicators with Mark Larson
In the fast-paced world of trading, technical indicators are invaluable tools that can help you make informed decisions. The Complete Guide to Technical Indicators with Mark Larson offers a comprehensive understanding of these essential tools. This guide will explore the key concepts, benefits, and strategies highlighted by Larson, providing you with the knowledge to enhance your trading skills.
Who is Mark Larson?
Mark Larson is a highly respected trader and educator known for his expertise in technical analysis. His insights have helped many traders achieve better results in the financial markets.
Why Trust Mark Larson?
Larson’s extensive experience and clear teaching style make complex concepts accessible. His proven strategies are backed by years of practical application and success.
Overview of Technical Indicators
Technical indicators are mathematical calculations based on the price, volume, or open interest of a security. They help traders identify trends, reversals, and other critical market conditions.
Types of Technical Indicators
- Trend Indicators: Show the direction and strength of a trend.
- Momentum Indicators: Measure the speed of price movement.
- Volume Indicators: Analyze the strength of a price move by looking at volume.
- Volatility Indicators: Assess the rate of price change.
Popular Technical Indicators
Moving Averages
Moving averages smooth out price data to identify the direction of a trend. They can be simple or exponential.
Simple Moving Average (SMA)
The SMA calculates the average price over a specific period, providing a straightforward trend indicator.
Exponential Moving Average (EMA)
The EMA gives more weight to recent prices, making it more responsive to new information.
Relative Strength Index (RSI)
RSI measures the speed and change of price movements, indicating overbought or oversold conditions.
Moving Average Convergence Divergence (MACD)
MACD shows the relationship between two moving averages, helping traders identify potential buy and sell signals.
Bollinger Bands
Bollinger Bands consist of a middle band (SMA) and two outer bands that represent standard deviations. They help identify overbought or oversold conditions and potential price reversals.
How to Use Technical Indicators
Combining Indicators
Combining multiple indicators can provide more reliable signals. For example, using RSI and MACD together can confirm trend strength and potential reversals.
Setting Parameters
Adjusting the parameters of indicators can tailor them to your trading style and the specific asset you’re analyzing.
Backtesting Strategies
Backtesting involves applying indicators to historical data to see how well they would have predicted past price movements. This helps refine strategies before applying them in live trading.
Benefits of Technical Indicators
Improved Decision Making
Technical indicators provide objective data that can help reduce emotional decision-making.
Identifying Trends
Indicators like moving averages and MACD help identify the direction and strength of trends, making it easier to enter and exit trades.
Spotting Reversals
Momentum and volume indicators can signal potential reversals, allowing traders to capitalize on changing market conditions.
Risk Management
Using indicators can help set stop-loss levels and manage risk more effectively.
Practical Applications of Technical Indicators
Day Trading
Day traders use indicators to make quick, informed decisions. Moving averages and RSI are popular choices for identifying short-term trends and entry points.
Swing Trading
Swing traders look for intermediate-term price movements. Indicators like Bollinger Bands and MACD help identify potential swing highs and lows.
Long-Term Investing
Long-term investors use indicators to identify major trends and make decisions based on broader market movements. Moving averages are particularly useful for confirming long-term trends.
Tips for Using Technical Indicators
Keep It Simple
Using too many indicators can lead to analysis paralysis. Focus on a few key indicators that work well together.
Understand Limitations
No indicator is perfect. It’s essential to understand the limitations and potential false signals of each indicator.
Stay Informed
Keep up with market news and events that can impact price movements, complementing your technical analysis with fundamental insights.
Real-Life Success Stories
Testimonials from Traders
Many traders have improved their performance by applying the strategies taught by Mark Larson. Here are a few success stories:
- Alice M.: “Using Larson’s methods, I was able to identify trends more accurately and make better trading decisions.”
- John R.: “The combination of RSI and MACD has become a cornerstone of my trading strategy, thanks to Larson’s clear explanations.”
Conclusion
The Complete Guide to Technical Indicators with Mark Larson is an essential resource for traders looking to enhance their skills. By understanding and applying the principles outlined in the book, you can improve your trading performance and make more informed decisions. Whether you’re a beginner or an experienced trader, Larson’s insights will help you navigate the complexities of the financial markets.
FAQs
1. What are technical indicators?
Technical indicators are mathematical calculations based on the price, volume, or open interest of a security. They help traders analyze market conditions.
2. How do moving averages work?
Moving averages smooth out price data to identify the direction of a trend. They can be simple or exponential, with the latter giving more weight to recent prices.
3. What is RSI used for?
The Relative Strength Index (RSI) measures the speed and change of price movements, indicating overbought or oversold conditions.
4. Can I use multiple indicators together?
Yes, combining multiple indicators can provide more reliable signals and help confirm trading decisions.
5. Where can I learn more about technical indicators?
Mark Larson’s book, The Complete Guide to Technical Indicators, is an excellent resource for learning about and applying these tools in trading.
Be the first to review “The Complete Guide to Technical Indicators with Mark Larson” Cancel reply
You must be logged in to post a review.
Related products
Forex Trading
Forex Trading
Forex Trading
Quantamentals – The Next Great Forefront Of Trading and Investing with Trading Markets
Forex Trading
Forex Trading
Forex Trading
Forex Trading
The Complete Guide to Multiple Time Frame Analysis & Reading Price Action with Aiman Almansoori
Forex Trading
Forex Trading
Forex Trading

 White Phoenix’s The Smart (Money) Approach to Trading with Jayson Casper
  Deep Dive Butterfly Trading Strategy Class with SJG Trades
  The Indices Orderflow Masterclass with The Forex Scalpers
  SQX Mentorship with Tip Toe Hippo







Reviews
There are no reviews yet.